Welcome to The Ultimate List of Email Marketing Statistics for 2025 – your definitive guide to understanding the pulse of the industry. This comprehensive, regularly updated resource brings together the most vital benchmarks, covering everything from average open rates and unparalleled ROI to the cutting-edge trends in automation, hyper-personalization, and beyond.
Quick Stats Overview
Before diving into the details, here are four headline stats that define the state of email marketing in 2025:
- Global Email Volume: Over 347 billion emails are sent and received daily in 2025.
- Average Open Rate: ~24%
- Average Click-Through Rate (CTR): ~3.5% across industries.
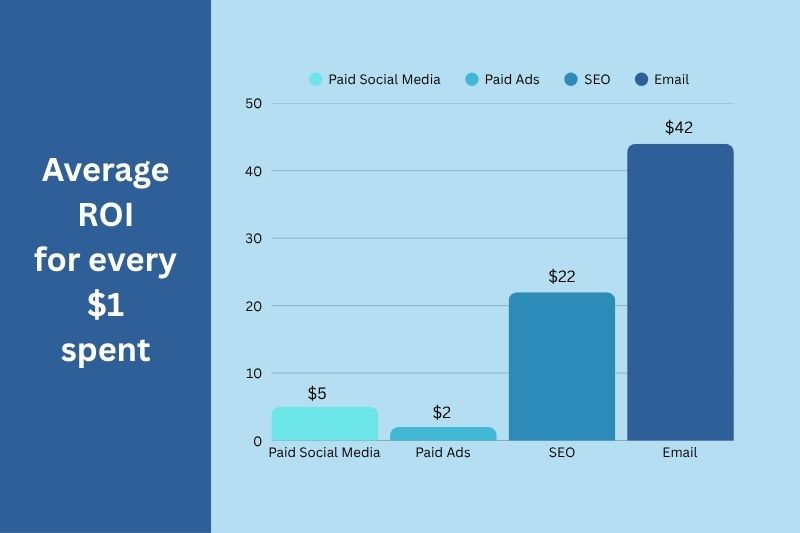
- Average ROI: $42 for every $1 spent
![]()
General Email Marketing Statistics
- 347 billion emails are sent and received each day in 2025. (Radicati Group, 2025 Email Market Report)
- 81% of SMBs rely on email as their primary customer acquisition channel. (Emarsys)
- The average email open rate across industries is approximately 24%. (Mailchimp Benchmark Report, 2025)
- The average ROI of email marketing in 2025 is estimated between $36 and $42 for every $1 spent, based on industry benchmarks. (Litmus)
- 99% of email users check their inbox every day; some as much as 20 times per day.(Zero Bounce Survey)
- In general, people tend to open emails in the morning, peaking around 10am and 11am local time. (Litmus)
- 65% of all email opens now happen on mobile devices. (HubSpot, 2025)
- 80% of marketers say email is their top channel for customer retention. (Statista, 2024)
- Subject line personalization can increase open rates by 20%. (Adobe Business)
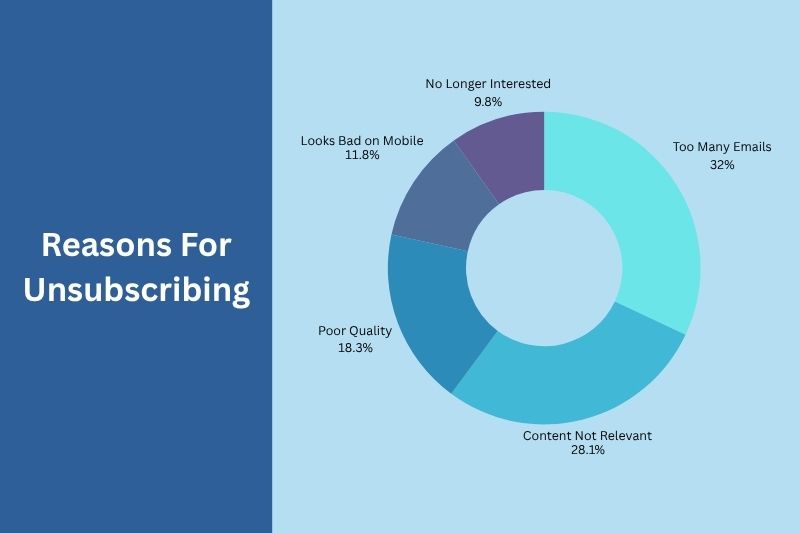
- Receiving too many emails is a common reason consumers unsubscribe (HubSpot).
- 36% cite lack of trust as a reason for ignoring outreach. (Hunter.io)
- 55% of all email opens happen on mobile devices. (Growthonomics)
- Email subject lines with fewer than 70 characters have the highest open rates, which analysts attribute to their optimization for mobile device display. (Shopify)
Key Takeaways: General Email Marketing Statistics
|
B2B Email Marketing Stats
- 73% of B2B marketers use email newsletters to nurture leads. (Marketing Profs)
- 42% of B2B marketers said email produced the best results among all distribution channels. (Content Marketing Institute)
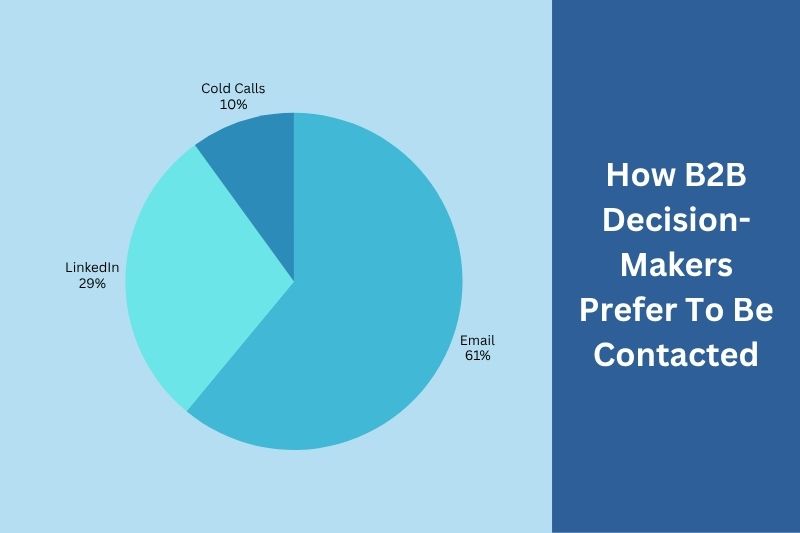
- 61% of decision-makers prefer cold email as their primary outreach channel, compared to 29% for LinkedIn and 10% for cold calls. (Hunter.io)
- The average B2B email open rate is almost 40%, compared to roughly 24% across all industries. (Klaviyo)
- 48% of decision-makers appreciate follow-ups. (Hunter.io)
- 71% of decision-makers cited lack of relevancy as the primary reason they ignore cold emails. (Hunter.io)
Key Takeaways: B2B Email Marketing Stats
|
Data sourced from Omnisend, Sagapixel, Sprout Social and SEO.com
B2C Email Marketing Stats
- 68% of consumers prefer email as their primary communication channel with brands. (eMarketer)
- 20.94% is the average open rate for B2C marketing emails, with a 2.57% average click-through rate. (Mailmondo)
- More than 50% of consumers purchase from an email at least once per month, with 59% saying marketing emails influence their buying decisions. (Mailmondo)
- 65% of B2C companies use some form of email marketing software to organize their content (GetResponse)
Key Takeaways: B2C Email Marketing Stats
|
E-commerce Email Statistics
- 33% of e-commerce revenue is driven by email marketing. (Omnisend, 2025)
- The average email marketing ROI for e-commerce businesses is $68 for every dollar spent in the US (and $40 globally). (Omnisend, 2025)
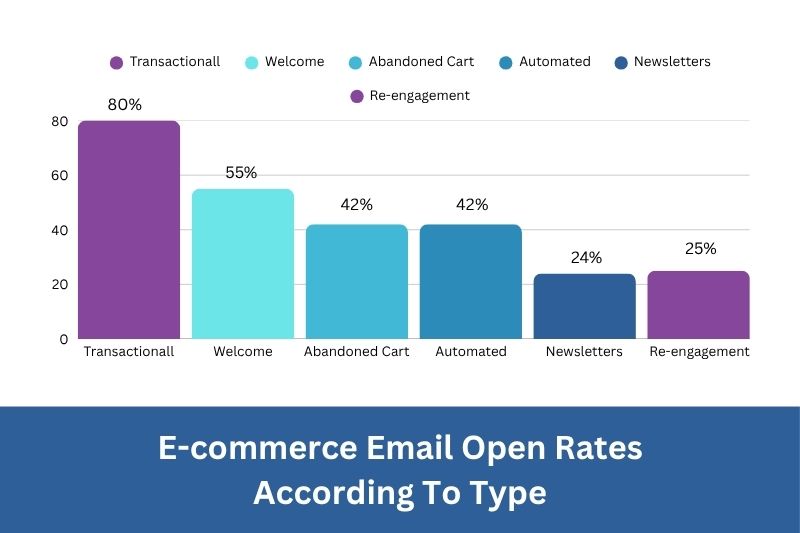
- Welcome emails have an average open rate of 50%, making them 86% more effective than standard newsletters. (Invesp)
- Abandoned cart emails recover 3–5% of lost sales on average. (Klaviyo)
- Abandoned cart emails achieve an open rate of 39.07% and a click-through rate of 23.33%, with a 10.7% conversion rate. (Analyzify)
- E-commerce brands sending automated campaigns (welcome, cart recovery, post-purchase) see up to 320% more revenue per email compared to one-off newsletters. (Omnisend, 2025)
Key Takeaways: E-commerce Email Statistics
|
Data sourced from Zoho, Moosend, Omnisend and Experian
Automation & Personalization
- Personalized subject lines can increase email open rates by 26%. (Campaign Monitor)
- Marketers using advanced segmentation see a 760% increase in revenue. (Campaign Monitor)
- Behavior-based emails drive 3x higher engagement than scheduled blasts. (Moosend)
- Emails with personalized content see 6x higher transaction rates, making it one of the most effective email marketing strategies. (Hubspot)
- Using customers’ names in email copy is the most common strategy marketers use to personalize their marketing emails (Hubspot)
- 43% cite impersonality as a reason for ignoring outreach. (Hunter.io)
- According to Hunter’s 2025 State of Cold Email Report, campaigns targeting fewer than 50 recipients have an average reply rate of 5.8%, compared to 2.1% for campaigns with over 1,000 recipients. This highlights the benefit of smaller, segmented lists. (Hunter.io)
Key Takeaways: Automation & Personalization
|
ROI & Revenue Benchmarks
- Average ROI: Between $36 and $42 for every $1 spent. (Litmus) This average is higher than paid ads, social media ads and SEO.
- Automated emails drive 37% of all email-generated sales, despite making up only 2% of email volume. (Litmus)
- Nearly 50% of consumers made a purchase directly from an email in the past year. (Omnisend, 2025)
- For email campaigns, the average conversion rate across all industries is 0.08%, with top 10% performers reaching 0.44% (5x higher). (Klaviyo)
- Transactional emails have 8x higher opens and clicks compared to regular marketing emails. (Experian, 2024)
- Companies that dedicate over 15% of their marketing budget to email marketing are 2X more likely to have open rates of 40% or more than the average company. (Litmus, 2025)
Key Takeaways: ROI & Revenue Benchmarks
|
Data sourced from Omnisend, Sagapixel, Sprout Social and SEO.com
Frequency, Unsubscribes & Deliverability
- 1 in 6 marketing emails never reach the inbox, getting filtered to spam or blocked outright. (Litmus)
- 81% of marketers say improving deliverability is a top priority. (Litmus)
- Sending emails 2–4 times per month yields the highest engagement. (Campaign Monitor, 2024)
- 86% of companies send marketing emails at least monthly, with 58% emailing their subscribers weekly or more often. (Litmus)
- Brands sending daily emails see higher ROI but also higher unsubscribe rates. (Litmus)
- Emails with clear opt-out links see 14% higher deliverability.
- Proper email authentication (SPF, DKIM, DMARC) can significantly improve inbox placement, with finance industries seeing 88% inbox placement with proper authentication. (Inboxally)
- The average email unsubscribe rate across all industries is around 0.19% to 0.26%. This means that for every 1000 emails sent, you can expect about 2-3 subscribers to opt out. (Mailmondo)
- Unsubscribe rates increase after the 3rd follow-up. (Hunter.io)
Key Takeaways: Frequency, Unsubscribes & Deliverability
|
Data sourced from Hubspot, Hunter and Litmus. Note that participants could have selected more than one option.
Interactive & Creative Practices
- 97% of marketers use at least one interactive element in their emails. The most effective interactive elements include interactive buttons/CTAs, forms, surveys and embedded videos or GIFs (12%). (Litmus)
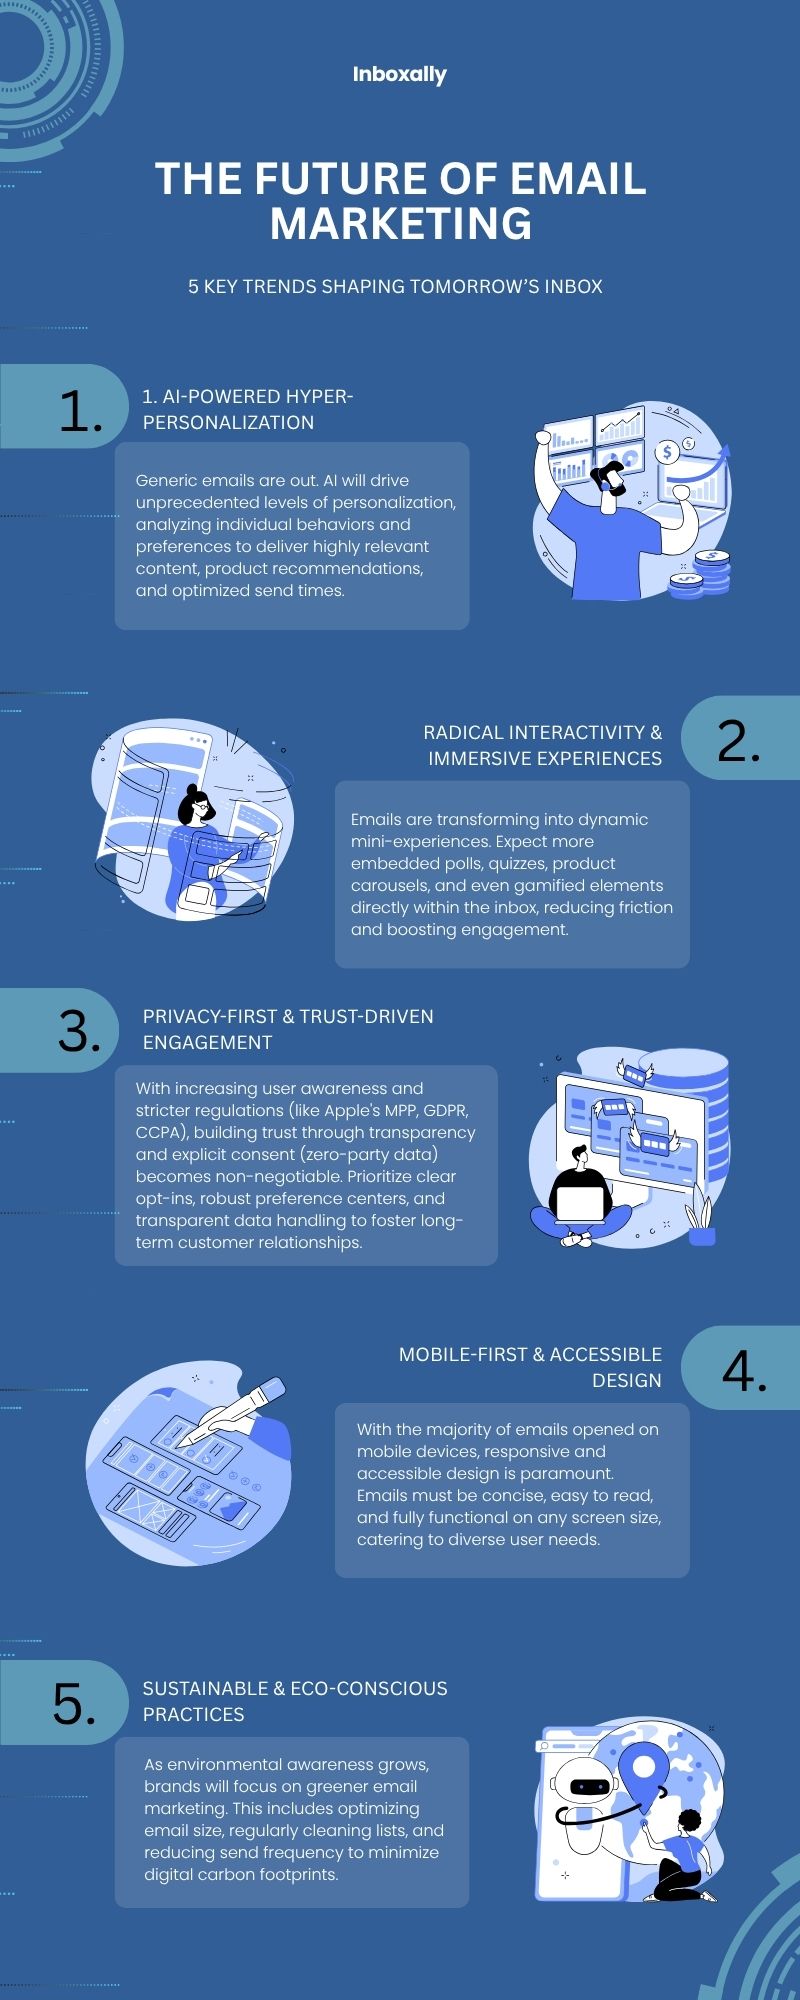
- Next-Gen Interactivity will become mainstream, with embedded polls, surveys, quizzes, and interactive product carousels within emails, turning emails into extensions of websites or apps to remove friction. (LocaliQ)
- Emails with interactive content see a 73% higher click-to-open rate (CTOR) compared to static emails. (Virfice)
- Gamification within emails (e.g., spin-the-wheel discounts, scratch-offs, progress bars) will increasingly be used to delight subscribers, boost click-through rates, and encourage repeat engagement. (Delivra)
Key Takeaways: Interactive & Creative Practices
|
AI & Future Trends
- In 2025, 49% of marketers use generative AI for static copy creation in emails, and the number of marketers using AI-powered image generation has increased by 340% in the last year. (Martech)
- Marketers predict that up to 75% of their email operations will be AI-driven by the end of 2026. (Litmus)
- 41% of companies will use AI-driven analytics by the end of 2026. Most impactful AI use cases are personalization, analyzing campaign performance, segmenting audiences, A/B testing and optimizing send times. (Litmus)
- 2026 is projected to be the year of AI-driven email marketing, where AI will augment, not replace, human employees, driving growth beyond just cost savings. (CDP Institute)
- By 2027, generative AI is anticipated to power over 60% of digital content creation processes, drastically reducing production time while maintaining high-quality, contextually relevant outputs for hyper-personalized email content at scale. (Byteplus)
- Privacy-First Email Marketing will be mandatory, with businesses prioritizing transparency, explicit user consent (zero-party data), and compliance with evolving global data protection regulations (beyond GDPR/CCPA). (Brevo)
- Sustainability-centric email campaigns will grow in importance, with a focus on minimalist design, reduced file sizes, and clean email lists to lower energy consumption and align with eco-conscious consumer values. (Brevo)
Key Takeaways: AI & Future Trends
|
Conclusion
As these statistics for 2025 clearly show, email marketing isn’t just surviving – it’s thriving and rapidly transforming. Far from being a relic, the inbox remains the most powerful and direct channel for engaging your target audience, driving sales, and building lasting relationships.
The future of email is undeniably smarter, more sophisticated, and intensely focused on the recipient. From the game-changing power of AI-driven personalization and the immersive potential of interactive experiences to the fundamental shift towards privacy-first engagement and sustainable practices, tomorrow’s inbox will demand a more intelligent, respectful, and dynamic approach.
The brands that embrace these key trends will not just meet expectations but exceed them, cultivating deeper trust and achieving unparalleled results.
